steinborn.dev
← all projects

AssayVault

One warehouse for every stability study, from raw instrument export to a defensible ICH Q1E shelf-life answer. The same records reach across molecules and years.

Python · dbt · DuckDB · Dagster · pandera · Streamlit · FastAPI
proprietary · architecture walkthrough on request · all data synthetic
93,480
analytical results
642
formulations
652
batches
2,147
automated tests
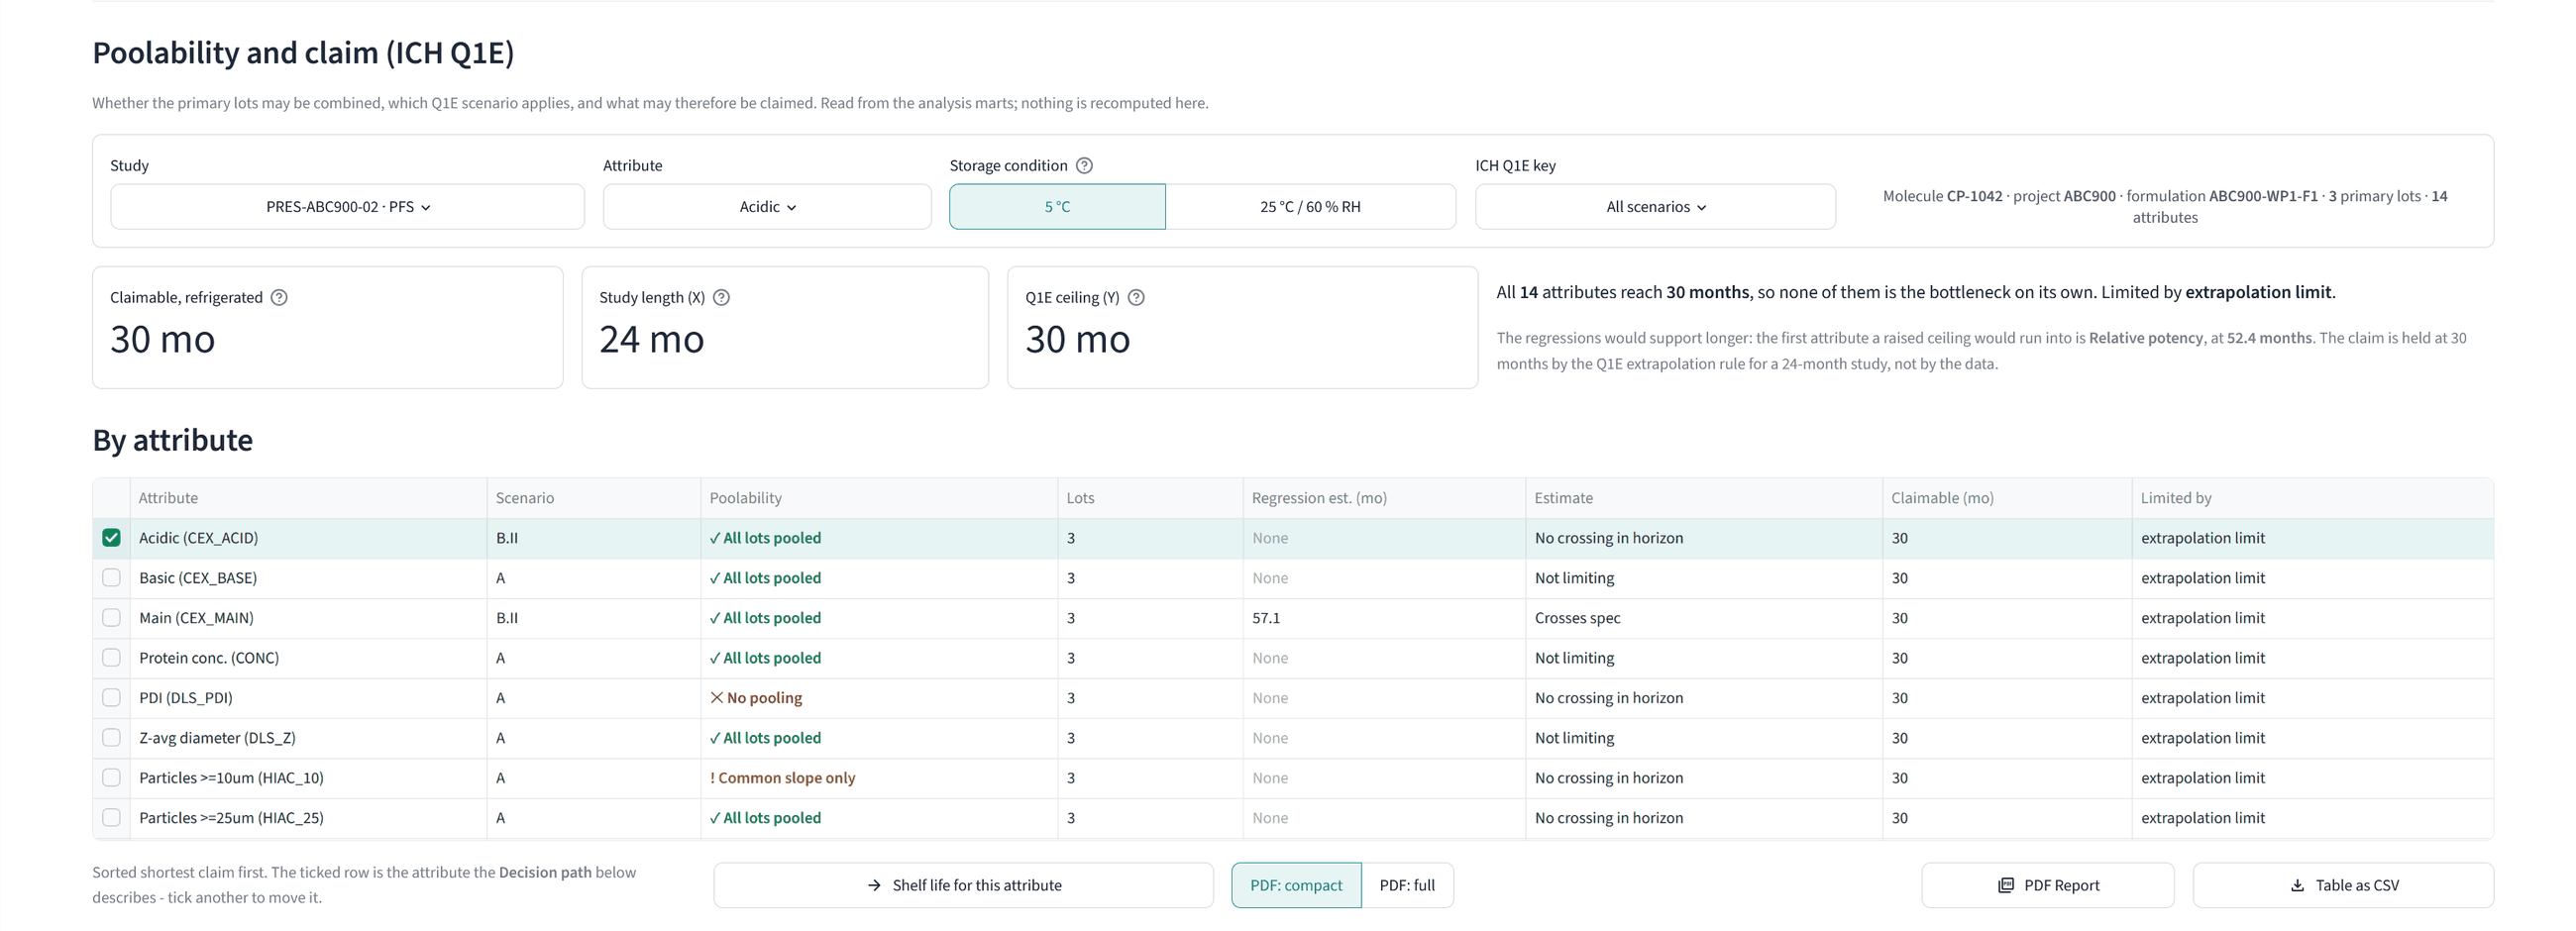
The AssayVault poolability and claim page: Q1E scenarios, poolability, and the claimable shelf life per attribute
the Q1E poolability & claim page · 14 attributes · which shelf life each one supports · synthetic data
01 · The problem

How long does this drug product actually last?

Stability studies (ICH Q1A) produce large volumes of measurements across formulations, storage conditions, timepoints, and methods. The data arrives as messy per-instrument exports - SEC-HPLC, CEX-HPLC, DLS, HIAC, potency - with cryptic sample identifiers and no shared schema.

The question that matters is regulatory: the supported shelf life under ICH Q1E. Answering it takes three separate statistical judgements - per-batch regression, poolability of batches, and admissible extrapolation - that must line up. AssayVault models exactly that chain, end to end.

The awkward part is that none of those three judgements is independent. Whether batches may be pooled changes which regression carries the claim. The claim in turn decides how far beyond the observed data the answer may reach. A spreadsheet holds any one of them comfortably. Holding all three at once, for 24 molecules across 52 projects, is where it stops being the right tool.

02 · The system
Dagster: asset graph · schedule · blocking checks raw exports 6 instrument sources ingest adapters · name parser pandera contracts quarantine + load audit warehouse dbt · DuckDB · star · SCD2 analysis marts Q1E chain · kinetics · OOS dashboard Streamlit · 14 pages API FastAPI · read-only
every displayed number is computed at build time - the dashboard renders, it does not calculate

The warehouse is 34 dbt models over DuckDB, layered into staging, marts and analysis. The whole graph runs as a Dagster asset job with its data-quality checks wired in as blocking asset checks: nine assets, five checks, one command.

03 · Why it holds up

The full Q1E chain under version control

Per-batch shelf-life regression with confidence-band crossing, ANCOVA poolability, and the seven-branch extrapolation decision tree - checked against a versioned rule base (Q1E-2003 and the 2025 consolidated draft). Every result carries its full reasoning path.

Data contracts at the door

Six export formats stand in for the instruments a real lab runs, no two of them shaped alike: chromatography long with one peak per row, a European DLS with semicolon separators and decimal commas, a particle counter that puts metadata lines above its header, wide summaries from the bench and the potency assay. Each format carries an explicit pandera schema. Unparseable rows are quarantined and audited, so nothing disappears silently. Adding another instrument is a reader function, one line in the source registry, its own schema, and a staging model onto the shared result grain.

Two implementations that must agree

The central fact table is computed independently in Python and in SQL, with a test proving row-level equality including OOS flags. A mutation harness then verifies that the suite actually catches a wrong regulatory constant.

Reproducible builds, portable warehouse

Byte-reproducible builds guarded by cryptographic fingerprints, deterministic PDF reporting, architecture decision records, and one dbt model set that builds on both DuckDB and Snowflake.

A risk score that is allowed to be believed

A regularized logistic regression estimates the probability that a unit will ever leave its specification, validated out-of-fold with a grouped split over molecules so no prediction comes from a model that had already seen its own molecule. It reports a ROC-AUC of 0.976 and a mean predicted risk of 20.6% against an observed 20.3%. That second pair is the one that matters: a model whose average misses the base rate cannot be read as a probability, however well it ranks.

Every number on screen was computed before the screen existed

The dashboard renders, it does not calculate. Fourteen pages read from analysis marts the build produced, which is what makes a screenshot reproducible and a claim auditable. Shelf-life reports are rendered deterministically to PDF. Cryptographic fingerprints let two runs on the same inputs be shown to be the same run.

One model that breaks the project silos

Every formulation ever put on stability sits in one decomposed model, alongside a curated reference of 199 marketed antibody products from FDA, EMA, and NMPA labels. Cross-study questions - has a formulation like this been on stability before, and how did it age? - become filters, and they are trustworthy for the same reason the Q1E claim is: the records are genuinely comparable.

Plus:

a curated, queryable library of 199 marketed antibody products from FDA, EMA and NMPA labels, with cross-domain composition similarity search.

04 · What it produces

A shelf-life answer per attribute, with its reasoning attached. 24,266 evaluated attribute and condition combinations resolve into 56 claims, each carrying the regression, the poolability verdict and the extrapolation branch that produced it.

A specification history that survives revisions. 363 effective specification versions sit behind the results as a slowly changing dimension, so a result keeps the verdict it had on the day it was measured. Tightening a limit in 2026 does not silently re-flag 2024.

A risk ranking across 19,016 units. Which combinations of formulation, lot, storage condition and attribute deserve attention before they leave specification.

A reference library of what is already on the market. 199 marketed antibody products drawn from FDA, EMA and NMPA labels, queryable by composition, so a new formulation can be compared against approved practice rather than against memory.

05 · Scope

The data is synthetic. Every number on this page comes from a generator, not from a laboratory. That is a licensing constraint rather than a shortcut. The deliverable is the pipeline, the guards and the validation, all of which behave the same once real history is plugged in. The ROC-AUC in particular measures how learnable the simulated degradation process is. The model card says so in those words.

Snowflake is prepared, not proven. The same dbt models build against a second profile, which has not been run against a live account.

Nothing here has been audited. The system is built to the habits that make an audit possible: versioned rules, reproducible builds, a traceable path from instrument export to reported number. Whether it would satisfy a particular inspection is a question for a validation exercise that has not been run.

The regulatory logic is an implementation, not an authority. It follows ICH Q1E and the 2025 consolidated draft as a versioned rule base. Every result records which rule set produced it. It does not replace a regulatory assessment.

06 · Notes from this project
2026-09-01 data-science

When a 0.976 ROC-AUC means nothing

Group-wise validation and leakage guards in AssayVault's OOS risk model. Why it reports a shiny number and refuses to brag about it.

2026-08-27 data-science

Tuning on the test set without noticing

Choosing a hyperparameter on the same folds that report the score inflates it. Nested cross-validation is what restores the separation.

2026-08-26 data-science

Your random split is lying to you

Data leakage explained from first principles. Why AssayVault validates its OOS model with GroupKFold over molecules instead of random rows.

2026-08-19 data-science

Why the boring model won

Under the hood of AssayVault's OOS risk model. Why a regularized logistic regression beats gradient boosting when the answer has to be defended.

2026-08-17 data-engineering

Prove your pipeline twice

Two independent implementations of one fact table. A mutation harness then checks whether the tests would notice a wrong constant.

2026-08-12 biopharma

The stability rulebook is being rewritten

ICH is consolidating the Q1A to Q1E series and Q5C into a single stability guideline. What that means for anyone whose shelf-life logic lives in code.

2026-08-04 data-science

How a recipe becomes a row

Encoding decides what a model can learn about a formulation, which is why AssayVault's excipient bridge table is the feature encoding and not just a data model.

2026-08-03 data-engineering

Your spec is a slowly changing dimension

Why AssayVault evaluates every result against the limit in force on its measurement date. What Kimball has to do with GxP.

2026-07-28 data-engineering

Your stability data needs a contract

What pandera schemas catch at the door that dashboards never show. Why quarantine beats silent coercion.

See it running.

Open live demo
synthetic data · fourteen dashboard pages · read-only · idle apps take a moment to wake